File:C02 in atmosphere chart-3.png

Original file (570 × 800 pixels, file size: 133 KB, MIME type: image/png)
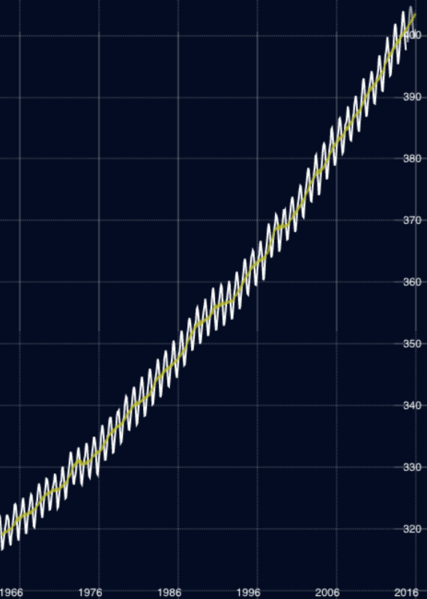
The Keeling Curve
- Keeling's Curve has been called one of the most important scientific works of the 20th century
On Mauna Loa in Hawaii, decades of mountaintop CO2 measurements chart an ominous climate record
Scripps Institute CO2 measurements at Mauna Loa have been supported for many years by the U.S. Department of Energy (DOE), and have more recently been supplemented by Earth Networks, a technology company collaborating with Scripps to expand the global GHG monitoring network. Support for website development was provided in part by the National Science Foundation (NSF).
NOAA additionally has been taking measurements of greenhouse gas emissions from the site since May 1974 in parallel with Scripps scientists.
Oh NOAA, Oh Mauna Loa
2025

July 2025
🌎
2024
Note: Based on the annual analysis from NOAA’s Global Monitoring Laboratory, the global average atmospheric carbon dioxide was 422.8 ppm in 2024, a new record high.
The CO2 increase during 2024 was +3.75 ppm. The LARGEST one-year increase on record.

CO2 measurements ...
July 2024: 425.55 ppm
July 2023: 421.83 ppm
🌎
2023
CO2 Measurements @Mauna Loa, Hawaii
• https://scripps.ucsd.edu/programs/keelingcurve/
Highest Daily CO2 Records (by year) | Mauna Loa Observatory
Measurements are made by two independent CO2 monitoring programs (NOAA and Scripps) at the Mauna Loa Observatory in Hawaii about 3400 metres above sea level.
Hawaiian Volcanic Eruption Temporarily Disrupts the CO2 Measurements
- From the Mauna Loa site to a Mauna Kea site, the essential science data collection continues
🌎
2022
Year by Year, Measure and Monitor CO2 in the Atmosphere
🌎
2020 CO2: Metric Checking
• https://www.esrl.noaa.gov/gmd/ccgg/trends/monthly.html
• https://www.bloomberg.com/graphics/carbon-clock/
RISING EMISSIONS DRIVE GREENHOUSE GAS INDEX INCREASES
According to data from the Mauna Loa Observatory in Hawaii, the concentration of CO2 in the atmosphere is over 415 parts per million (ppm)... far higher than at any point in the last 800,000 years, since before the evolution of homo sapiens.

About the Mauna Loa Observatory
- The Carbon Clock is Ticking
- April 19: 413.86 ppm
- April 18: 413.43 ppm
- April 17: 413.63 ppm
- 🌎
········································································································


File history
Click on a date/time to view the file as it appeared at that time.
| Date/Time | Thumbnail | Dimensions | User | Comment | |
|---|---|---|---|---|---|
| current | 16:15, 15 April 2017 | | 570 × 800 (133 KB) | Siterunner (talk | contribs) |
You cannot overwrite this file.
File usage
The following 16 pages use this file:
- Climate News
- Climate News Events Archive ... 1970 to Today
- Earth and Space, Politics
- Environmental full-cost accounting
- GreenPolicy360 Archive Highlights 2020
- Life and the 'Human Niche' at Risk
- Planet Citizens
- Too Hot
- File:Changes in carbon dioxide per 1000 years - via Climate Central.jpg
- File:Earth in Human Hands.jpg
- File:Earth trapping unprecedented amount of heat - NASA.jpg
- File:Gistemp 1979-2019.png
- File:Keeling Curve 2024.png
- File:Mauna Loa-NOAA-Observatory.jpg
- File:Temperatures New Normal is Not Normal.jpg
- Category:Climate Policy
- Anthropocene
- Atmospheric Science
- Climate Change
- Climate Policy
- Earth Observations
- Earth Science
- Ecology Studies
- Education
- Environmental Security
- GreenPolicy360
- Global Security
- Green Graphics
- NOAA
- Planet Citizens
- Planet Citizens, Planet Scientists
- Renewable Energy
- Strategic Demands
- Sustainability Policies
- ThinBlueLayer
- Whole Earth